cascoda-sdk-pages
Segger J-Link Debug Guide
The SEGGER J-Link is the recommended tool for debugging baremetal applications created using the Cascoda SDK. The SEGGER J-Link has good integration to gdb, using a ‘GDB Server’ program to bridge the hardware to the gdb tool.
Software Requirements:
- A version of GDB that supports the target (For Chili2, can be arm-none-eabi-gdb or gdb-multiarch). See the development environment setup guide.
- The latest SEGGER J-Link Software & Documentation Pack
- Can be run on Windows, macOS or Linux
Hardware Requirements:
- A suitable SEGGER J-Link
- An adapter from the 20-pin JTAG to 9-pin or 10-pin swd connector
- The target platform (This guide assumes Chili2D)
Procedure
- Connect J-Link to Chili2D via debug adapter
- Power the Chili2D
- Connect the J-Link to the the host PC
- Run the SEGGER J-Link GDB Server
- Set the target device (M2351… For Chili2, NANO120… for Chili1)
- Set the target interface to SWD
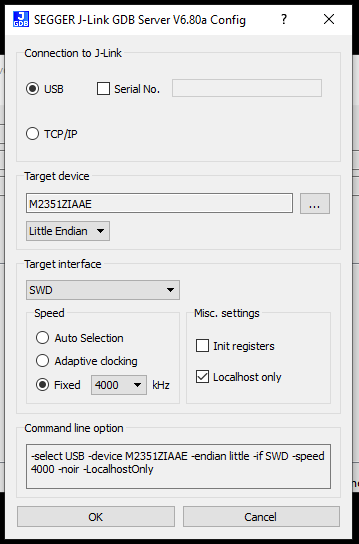
- Click OK, the JLink should connect to the target
- Check the log presented, it should print the port (usually 2331).
Connecting to J-Link...
J-Link is connected.
Firmware: J-Link V10 compiled Jun  9 2020 13:38:07
Hardware: V10.10
S/N: xxxxxxxx
Feature(s): GDB
Checking target voltage...
Target voltage: 3.28 V
Listening on TCP/IP port 2331
Connecting to target...
Connected to target
Waiting for GDB connection...
- Start GDB in the build directory with the command (substitute arm-none-eabi-gdb with gdb-multiarch if necessary, and reference the target binary instead of mac-dongle)
arm-none-eabi-gdb -ex "target remote localhost:2331" bin/mac-dongle
- Use the
monitor resetcommand to reset the target. Other useful commands:
| Command | Effect |
|---|---|
| load | Download the binary onto device flash |
| monitor reset | Reset and halt the target device |
| c | Continue a halted device |
| b |
Set a breakpoint at the location (can be function name, filename:linenum, and more) |
| p |
Print the value of a symbol (can also use other forms like p/x to print in hexadecimal) |
| x |
Examine the memory values at an address (can also use other forms like x/10xb to print 10 bytes in hex) |
GDB is a very powerful tool, there are many guides on the internet that will provide more detail, including the GDB documentation itself.
Debugging with VSCode
Rather than use raw GDB to debug we can use VSCode builtin debugger. First install the Cortex-Debug extension. With this you can now create a debug configuration (launch.json).
To use with the J-Link, this will look like:
{
    // Use IntelliSense to learn about possible attributes.
    // Hover to view descriptions of existing attributes.
    // For more information, visit: https://go.microsoft.com/fwlink/?linkid=830387
    "version": "0.2.0",
    "configurations": [
        {
            "name": "Cortex Debug",
            "cwd": "${workspaceFolder}/working_directory",
            "executable": "./path/to/exe",
            "request": "launch", #or attach
            "type": "cortex-debug",
            "serverpath": "C:\\Path\\To\\JLink\\JLinkGDBServerCL.exe",
            "runToEntryPoint": "main",
            "servertype": "jlink",
            "device": "M2351KIAAE", #processor for Chili2D
            "interface": "swd",
        }
    ]
}
To use with OpenOCD, this will look like:
{
    // Use IntelliSense to learn about possible attributes.
    // Hover to view descriptions of existing attributes.
    // For more information, visit: https://go.microsoft.com/fwlink/?linkid=830387
    "version": "0.2.0",
    "configurations": [
        {
            "name": "Cortex Debug",
            "cwd": "${workspaceRoot}",
            "executable": "./path/to/exe",
            // "request": "launch",
            "request": "attach",
            "serverpath": "C:\\Path\\To\\OpenOCD-Nuvoton\\src\\openocd.exe",
            "type": "cortex-debug",
            "servertype": "external", //NOTE: this means you will have to start the server manually
            "device": "M2351KIAAE",
            "configFiles": [
                "interface/nulink.cfg",
                "target/numicroM23.cfg"
            ],
            "gdbTarget": "localhost:3335",
            "searchDir": [
                "C:\\Path\\To\\OpenOCD-Nuvoton\\tcl"
            ],
        }
    ]
}
You should now be able to debug within VSCode and step through code interactively.